
In engineering management, my vision is to create a productive software delivery environment that developers are proud to work in, with a focus on tangible outcomes across the company.
It’s a system with the proper guidelines and the right level of automation, so standard development work gets done seamlessly. That’s why, in the engineering department, we implemented real-time team health boards. It gave us back some precious time to focus on systematic process improvements.
To fulfill such ambitions, the standard set of predefined methodology (Scrum, for example) and the ticketing system won’t do the trick out-of-the-box.
Measure What Matters Most: Roadmap Focus
The problem I struggle with most is the gap between software development ticketing tools and product management solutions.
Via engineering ticketing applications, we are told the top efficiency factors to look at are lead time, throughput, and their derivatives. It seems to me that these type of default indicators divert software companies from measuring what matters most: focus on outcome, represented by the roadmap. Other metrics are secondary. In practice, low lead time and high throughput don’t build trust when the roadmap gets delayed.
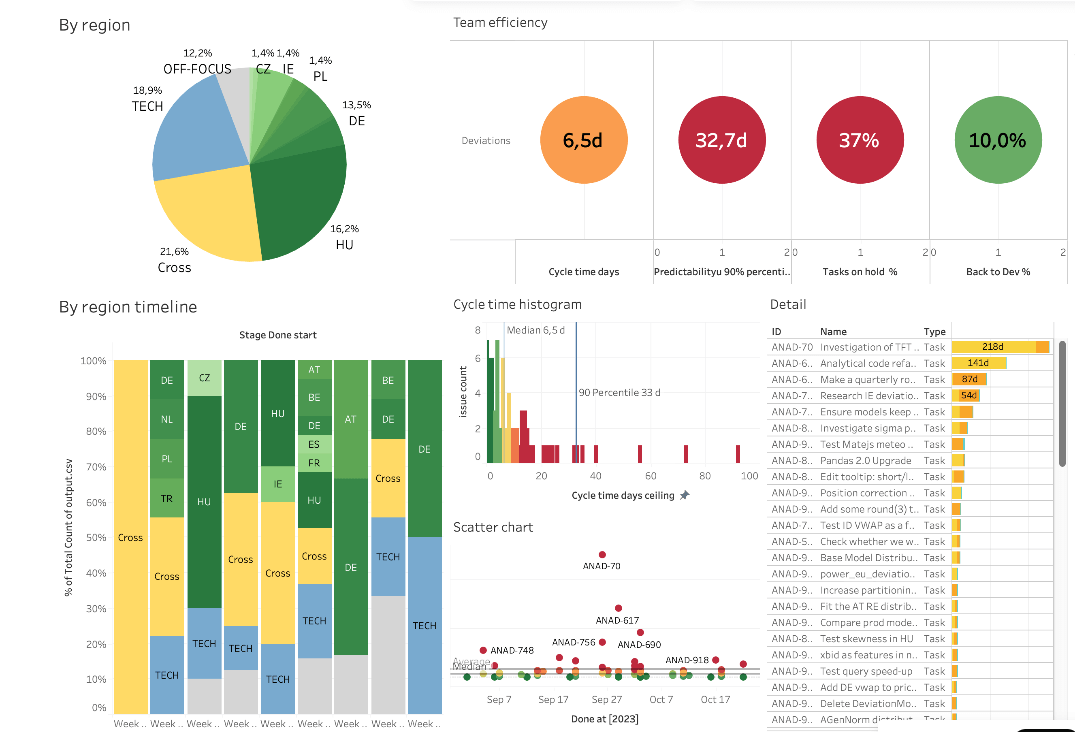
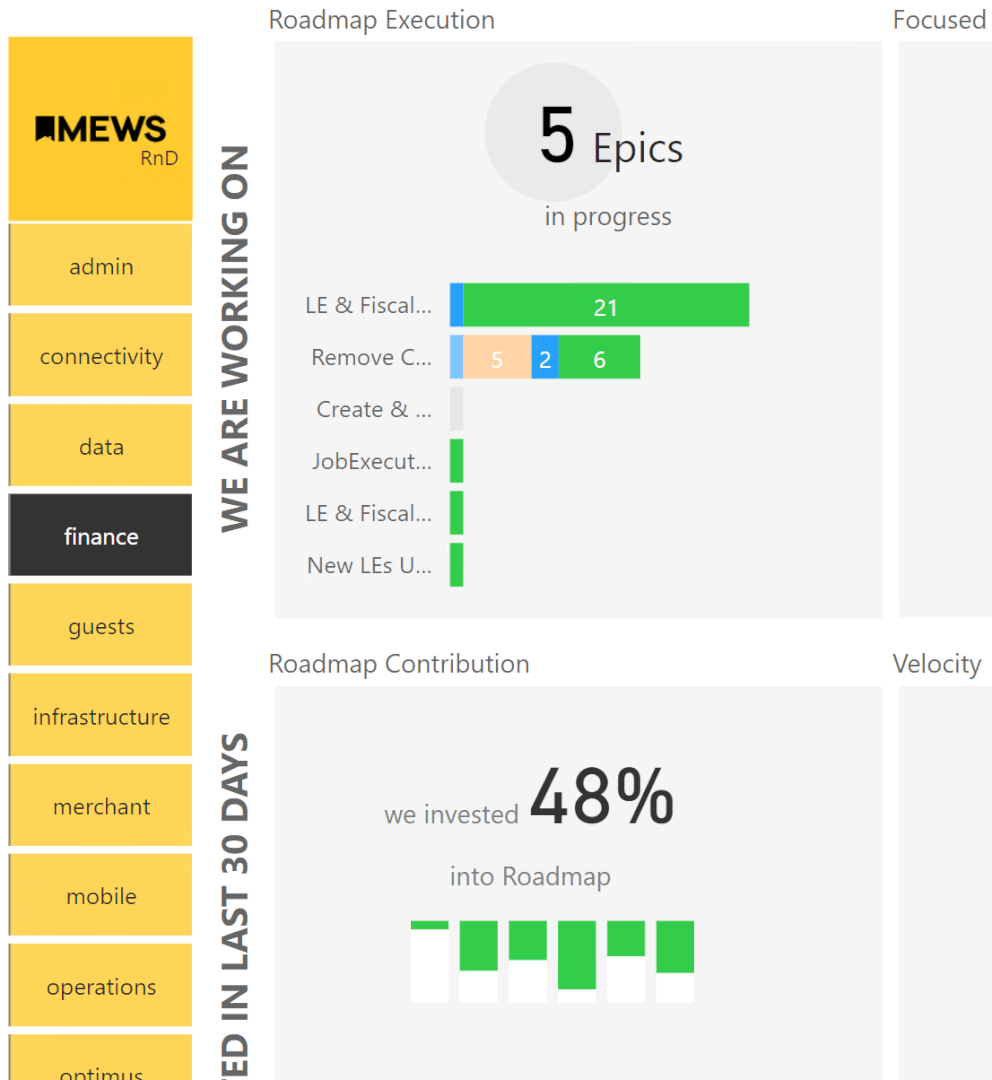
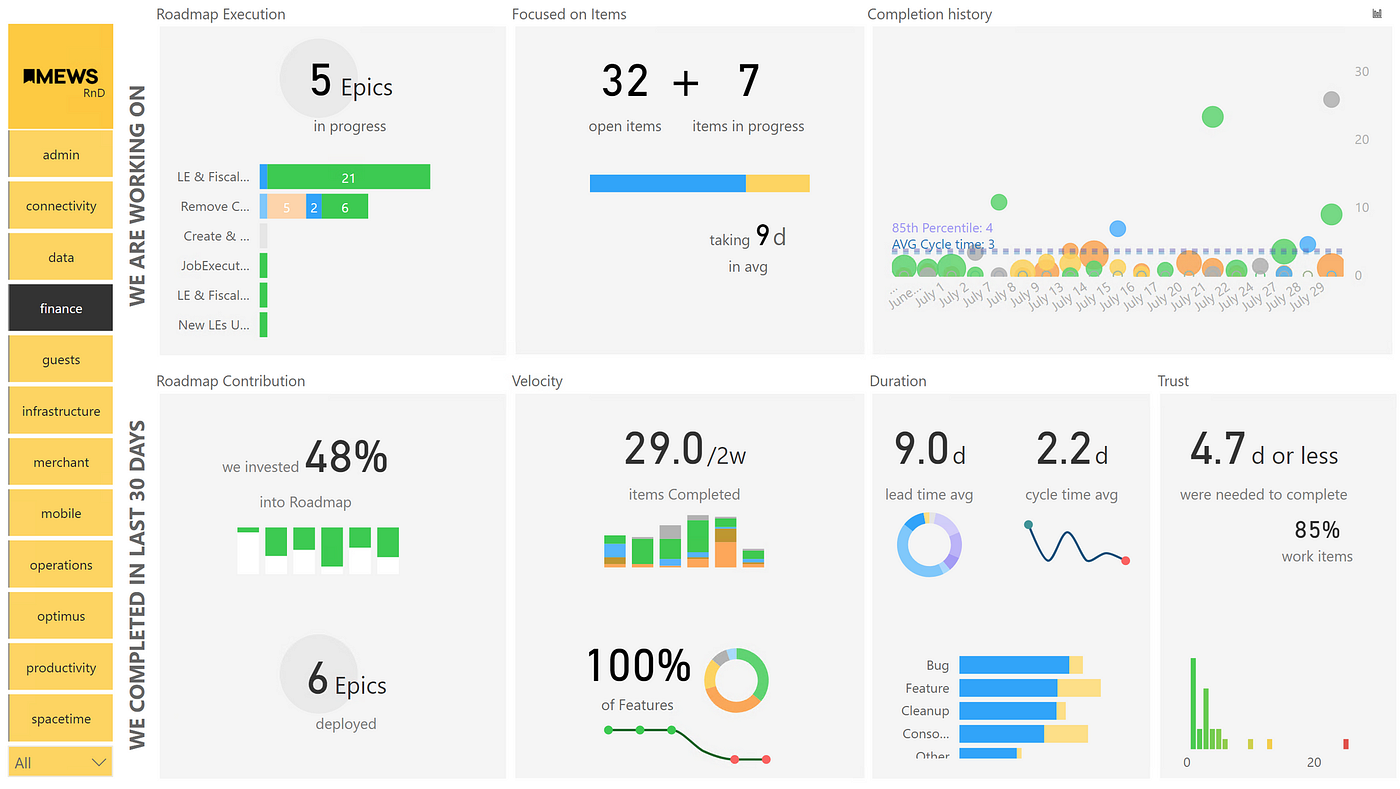
Health Board Indicators
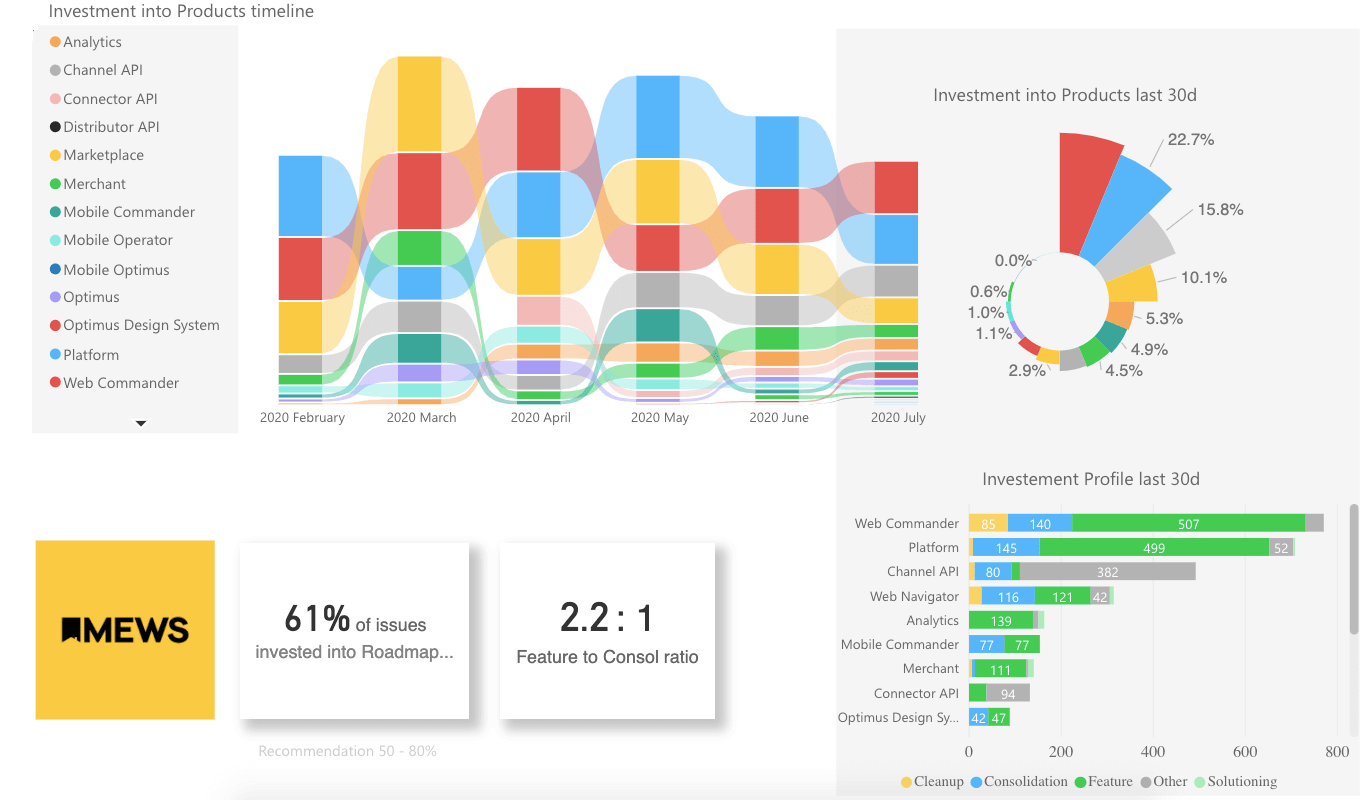
To visualize engineering outcomes and keep focus, we decided to implement a fully transparent health board with the following insights:
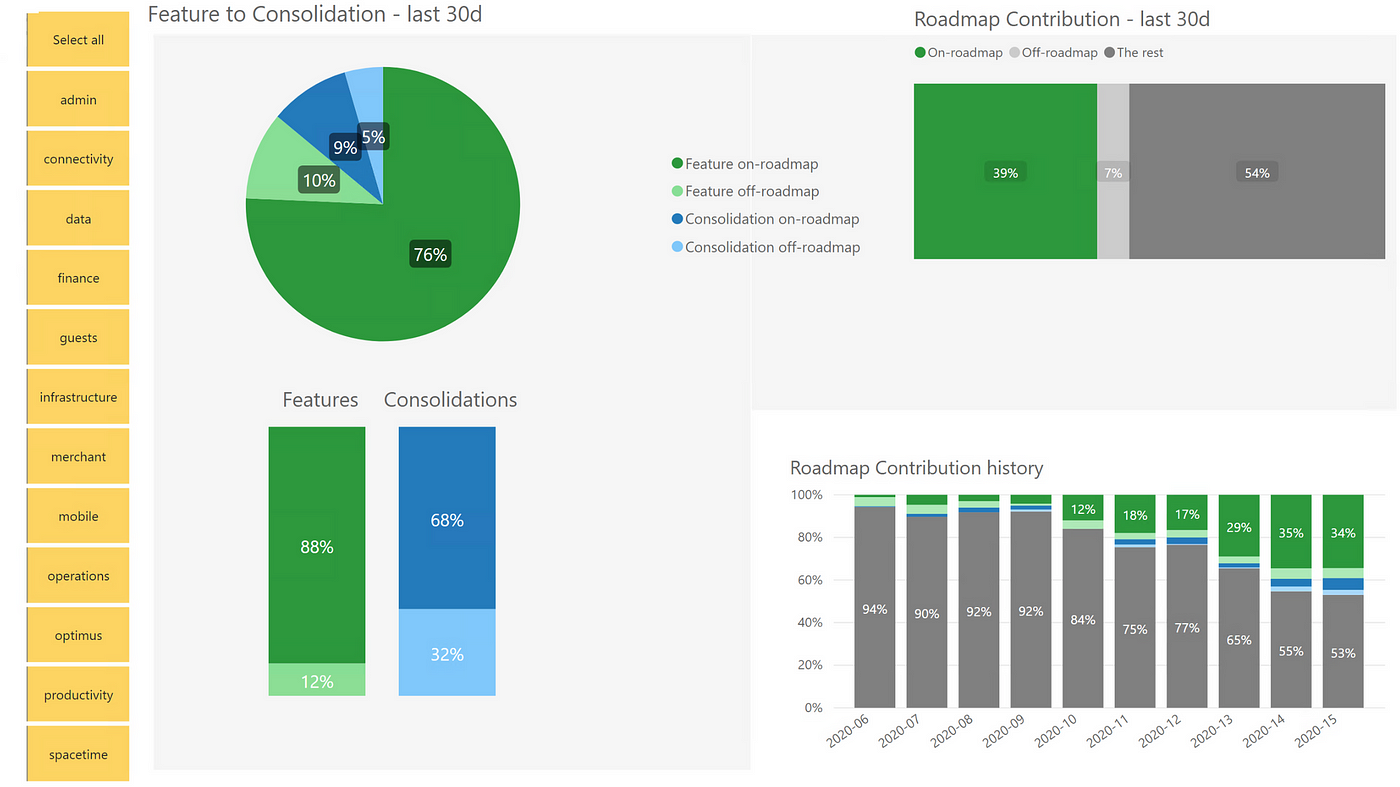
- What is our roadmap contribution % in the last 30 days? Do we plan well? Our expected guardrails are in the range of 50%-70%, depending on the product’s life cycle stage. Typically, startup products have a higher roadmap focus due to the low volume of support and maintenance work.
- What type of work distribution do teams have-bugs, cleanup, support, investigation? What work prevents the team from contributing to the roadmap? How much do we invest in tech debt/consolidation? To mitigate tech debt and potential bugs, we invest in features and consolidation in a 2:1 ratio.
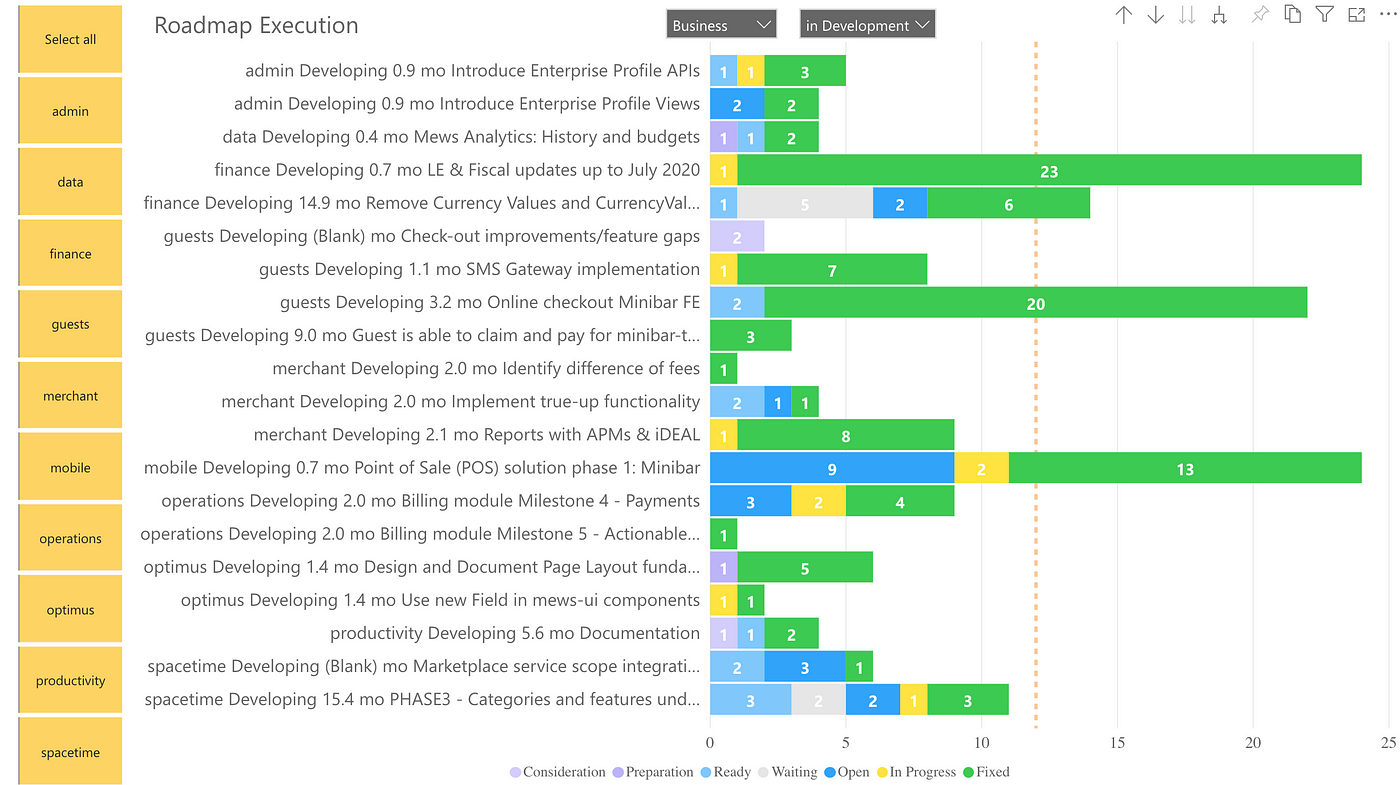
3. What’s the roadmap status? How many different initiatives (epics) does the team work on in parallel? To significantly reduce context-switching costs, we keep the number of parallel main initiatives to 1 or 2, depending on team size.
4. How much do we invest in which products? Such insights allow us to steer our workforce properly.
After the questions above were answered properly, we extended our health boards with standard indicators such as throughput, lead and cycle time, ad-hocs and long-lasting outlier occurrence, pull-request frequency, and code review duration.
On top of the metrics, we’re on the way to implementing notifications when situations go off-track (long-lasting ticket stages, approaching deadlines, proposals fit for the sprint planning, waste elimination). In essence, our goal is to mitigate firefighting situations, which are typically hard and time-consuming to resolve.
Build the Real-Time Health Boards in 3 Months
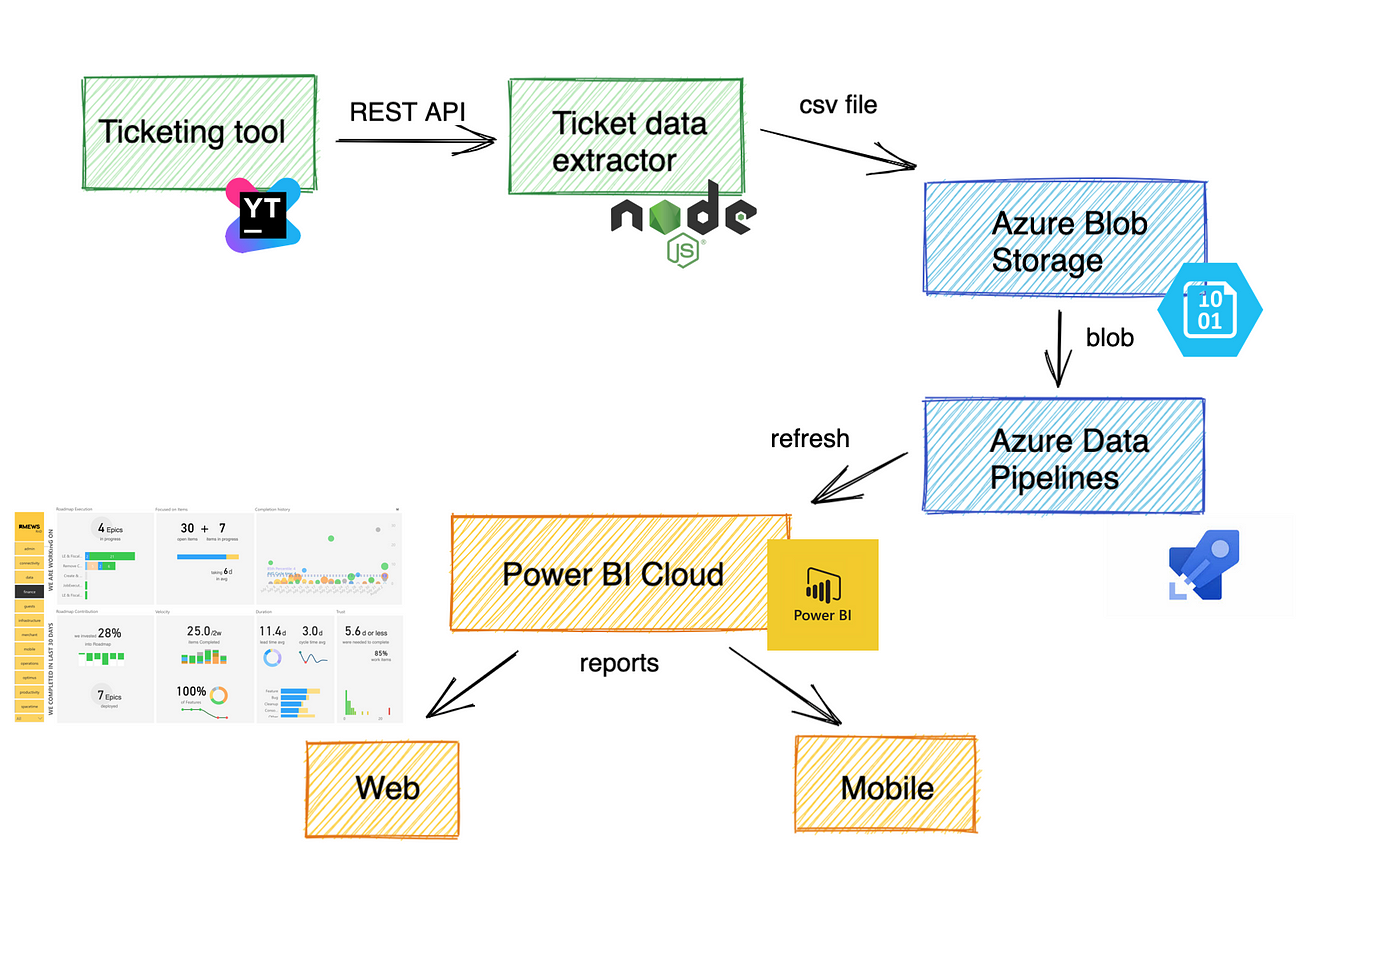
In a nutshell, a simple node.js service extracts all the ticketing data and respective changelogs from YouTrack via REST API calls. The output is then uploaded in the form of a csv file to Azure Storage. Next, the data factory enriches the attributes (ticket fields) with corresponding data types and creates the data table model based on our ticketing hierarchy. In Power BI Desktop we’re able to design desirable reports and publish them to Power BI Cloud. As a result, all the dashboards are refreshed automatically and accessible on the web or mobile app.
We implemented the boards end-to-end in the following steps:
Step 1: Create the Ticketing Structure
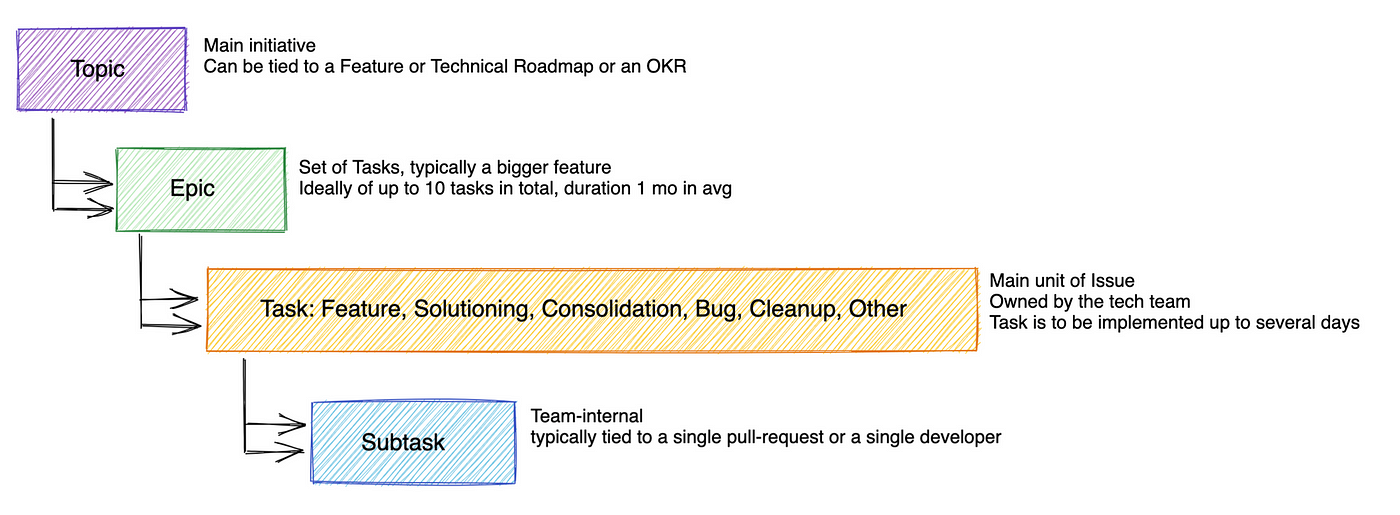
Internally, we made the decision to represent product roadmap initiatives in the hierarchical form of topics, epics, tasks, and subtasks, right in the ticketing system. For such purpose, thanks to quick change management, we adjusted the ticketing structure in YouTrack within a month. The alternative is to have an existing integration with any of the product management solutions.
Step 2: Extract the data
The next stage was to spend a month on a small node.js service implementation, responsible for extracting real-time ticketing information and, subsequently, feeding analytics data pipelines. The good news is that most of the ticketing solutions offer reliable access to data via REST API, including history changes.
Step 3: Use the Right Reporting Tool
Nowadays, analytics tools (like Power BI or Tableau) are fairly user-friendly and simple to use once a person understands their principles and how to digest and visualize the data they provide in the best possible form. It was extremely helpful to start gathering knowledge right away from the Power BI Desktop video channel and PowerBI.tips. That being said, we got the dashboards working in a month, thanks to people having software development backgrounds.
Practical outcomes
I admit we’re still at the beginning of our mission, although the outcome is tangible. Engineers and product managers have asked to improve the reports in various ways, along with additional adjustments of the ticket structure. We’re learning to use the reports on a daily basis and trust the data. I firmly believe clean data insights greatly increase the probability of investing in the right improvements and making the right decisions.
In practice, engineering health boards and reports have helped us in many ways:
- We made sure to plan sprints according to expectations, focusing mainly on roadmap contribution and eliminating other types of work.
- We put the cap on the number of high-level initiatives the team can work on in parallel.
- We reduced unplanned ad-hocs which disrupted the development process.
Most importantly, software engineering is perceived as highly transparent. Everyone in the company has access to the development team’s health board, roadmap progression, and product investment, which creates trust.
Lessons learned
Stakeholders used to say, based on feature delays, that “ Engineers can’t estimate”. As a software manager, you’re asked to “ Make better estimates”. In practice, I’ve learned that estimates are not the core issue.
https://cdn.embedly.com/widgets/media.html?src=https%3A%2F%2Fgiphy.com%2Fembed%2FR7m04yMaGWVeE%2Ftwitter%2Fiframe&display_name=Giphy&url=https%3A%2F%2Fmedia.giphy.com%2Fmedia%2FR7m04yMaGWVeE%2Fgiphy.gif&image=https%3A%2F%2Fi.giphy.com%2Fmedia%2FR7m04yMaGWVeE%2Fgiphy.gif&key=a19fcc184b9711e1b4764040d3dc5c07&type=text%2Fhtml&schema=giphy
- Focus on roadmap contribution to make teams succeed. Default ticketing tool metrics are secondary.
- Clean up the system. Measure the different types of work teams work on. Clean massive backlogs. Decrease context-switching and the occurrence of ad-hocs. Ensure engineers can keep the focus.
- As a change agent, if you decide to advance the structure of the company ticketing system, ask for a mandate to avoid potential push-backs.
- To make the reports reliable, take into account that you’ll invest an additional month into data cleanup.
- When building transparent dashboards, get ready to explain why and where it will help. Transparency isn’t meant to bully anyone-it’s here to make the right improvements and prevent firefighting situations.
- Avoid reports comparing individuals.
- Don’t aim to build the perfect development process. Instead, create a system that can handle 80% of issues seamlessly in the flow. Lead by example and teach others how to resolve the rest on demand.
For a long time, I was looking to find the right style of management to suit the most engineers. I went through a ton of books offering different strategies.
Simply put, the conclusion I came to is that data insight combined with empathy is the unbeatable way to manage both developers and feature delivery in the best possible manner.
About Marian Kamenistak
Marian provides coaching and mentoring to engineering managers and leaders across various levels, helping organisations to succeed in building products.
Stay tuned for the next post! ?